A good AQI for Los Angeles is 50 or below — but after manufacturing air filters for over a decade and serving more than two million households, we'll tell you something most air quality guides skip entirely: L.A. rarely stays there.
The basin geography, year-round wildfire smoke, and some of the heaviest traffic emission corridors in the country create an air quality environment that's genuinely unlike anywhere else we serve. In our experience, the days that look "moderate" on an AQI map are often the days L.A. residents underestimate — and the days indoor air quality suffers most.
This page shows you how to read the air quality index map los angeles, what the numbers and thresholds mean for your family, and how to keep the air inside your home cleaner than what’s happening outside your window.
TL;DR Quick Answers
air quality index map los angeles
The most accurate AQI map for Los Angeles is the South Coast AQMD's interactive map at aqmd.gov, which delivers neighborhood-level air quality readings at more than 1,000 locations across the Basin. For a federal benchmark, the EPA's AirNow platform at airnow.gov provides real-time readings and next-day forecasts sourced from official California monitoring stations.
Key facts Los Angeles residents should know:
A good AQI for Los Angeles is 50 or below — but Basin geography, traffic emissions, and wildfire smoke keep L.A. in the Moderate range of 51–100 for a significant portion of the year
Los Angeles County ranked third in the nation for unhealthy air quality days in 2025
L.A.'s annual PM2.5 levels run nearly 50% above the EPA's own safety standard
Moderate AQI days are the most underestimated air quality risk for L.A. households — outdoor pollutants infiltrate homes through windows, weatherstripping gaps, and under-filtered HVAC systems regardless of what the map reads
MERV 11 and MERV 13 filters are the most effective indoor defense for L.A. homes across both routine Moderate days and active wildfire and high-ozone events
Top Takeaways
A good AQI for Los Angeles is 50 or below — but L.A. rarely stays there. Basin geography, year-round wildfire smoke, and one of the nation's most congested freeway networks create a compounding air quality problem unlike almost anywhere else we serve.
The moderate AQI range is where L.A. households are most vulnerable. An AQI of 51–100 feels safe outdoors. Indoors, pollutants are still infiltrating through windows, weatherstripping gaps, and under-filtered HVAC systems. Moderate days quietly do the most damage.
L.A.'s annual PM2.5 levels run nearly 50% above the EPA's own safety standard. At 13.4 µg/m³ against a federal threshold of 9.0 µg/m³, this is not a weather event — it is a year-round condition. Fine particulate matter at these concentrations passes through low-rated filters without resistance.
Nearly 1 in 13 children in Los Angeles County has been diagnosed with asthma. Proximity to freeway corridors is a leading environmental driver. The households closest to L.A.'s most congested routes are the same ones we see replacing filters most frequently.
The AQI number on your phone is a starting point, not a finish line. The right MERV rating, the right replacement schedule, and an understanding of how quickly L.A. conditions load a filter is what turns air quality awareness into air quality protection.
Understanding the AQI Scale: What the Numbers Actually Mean
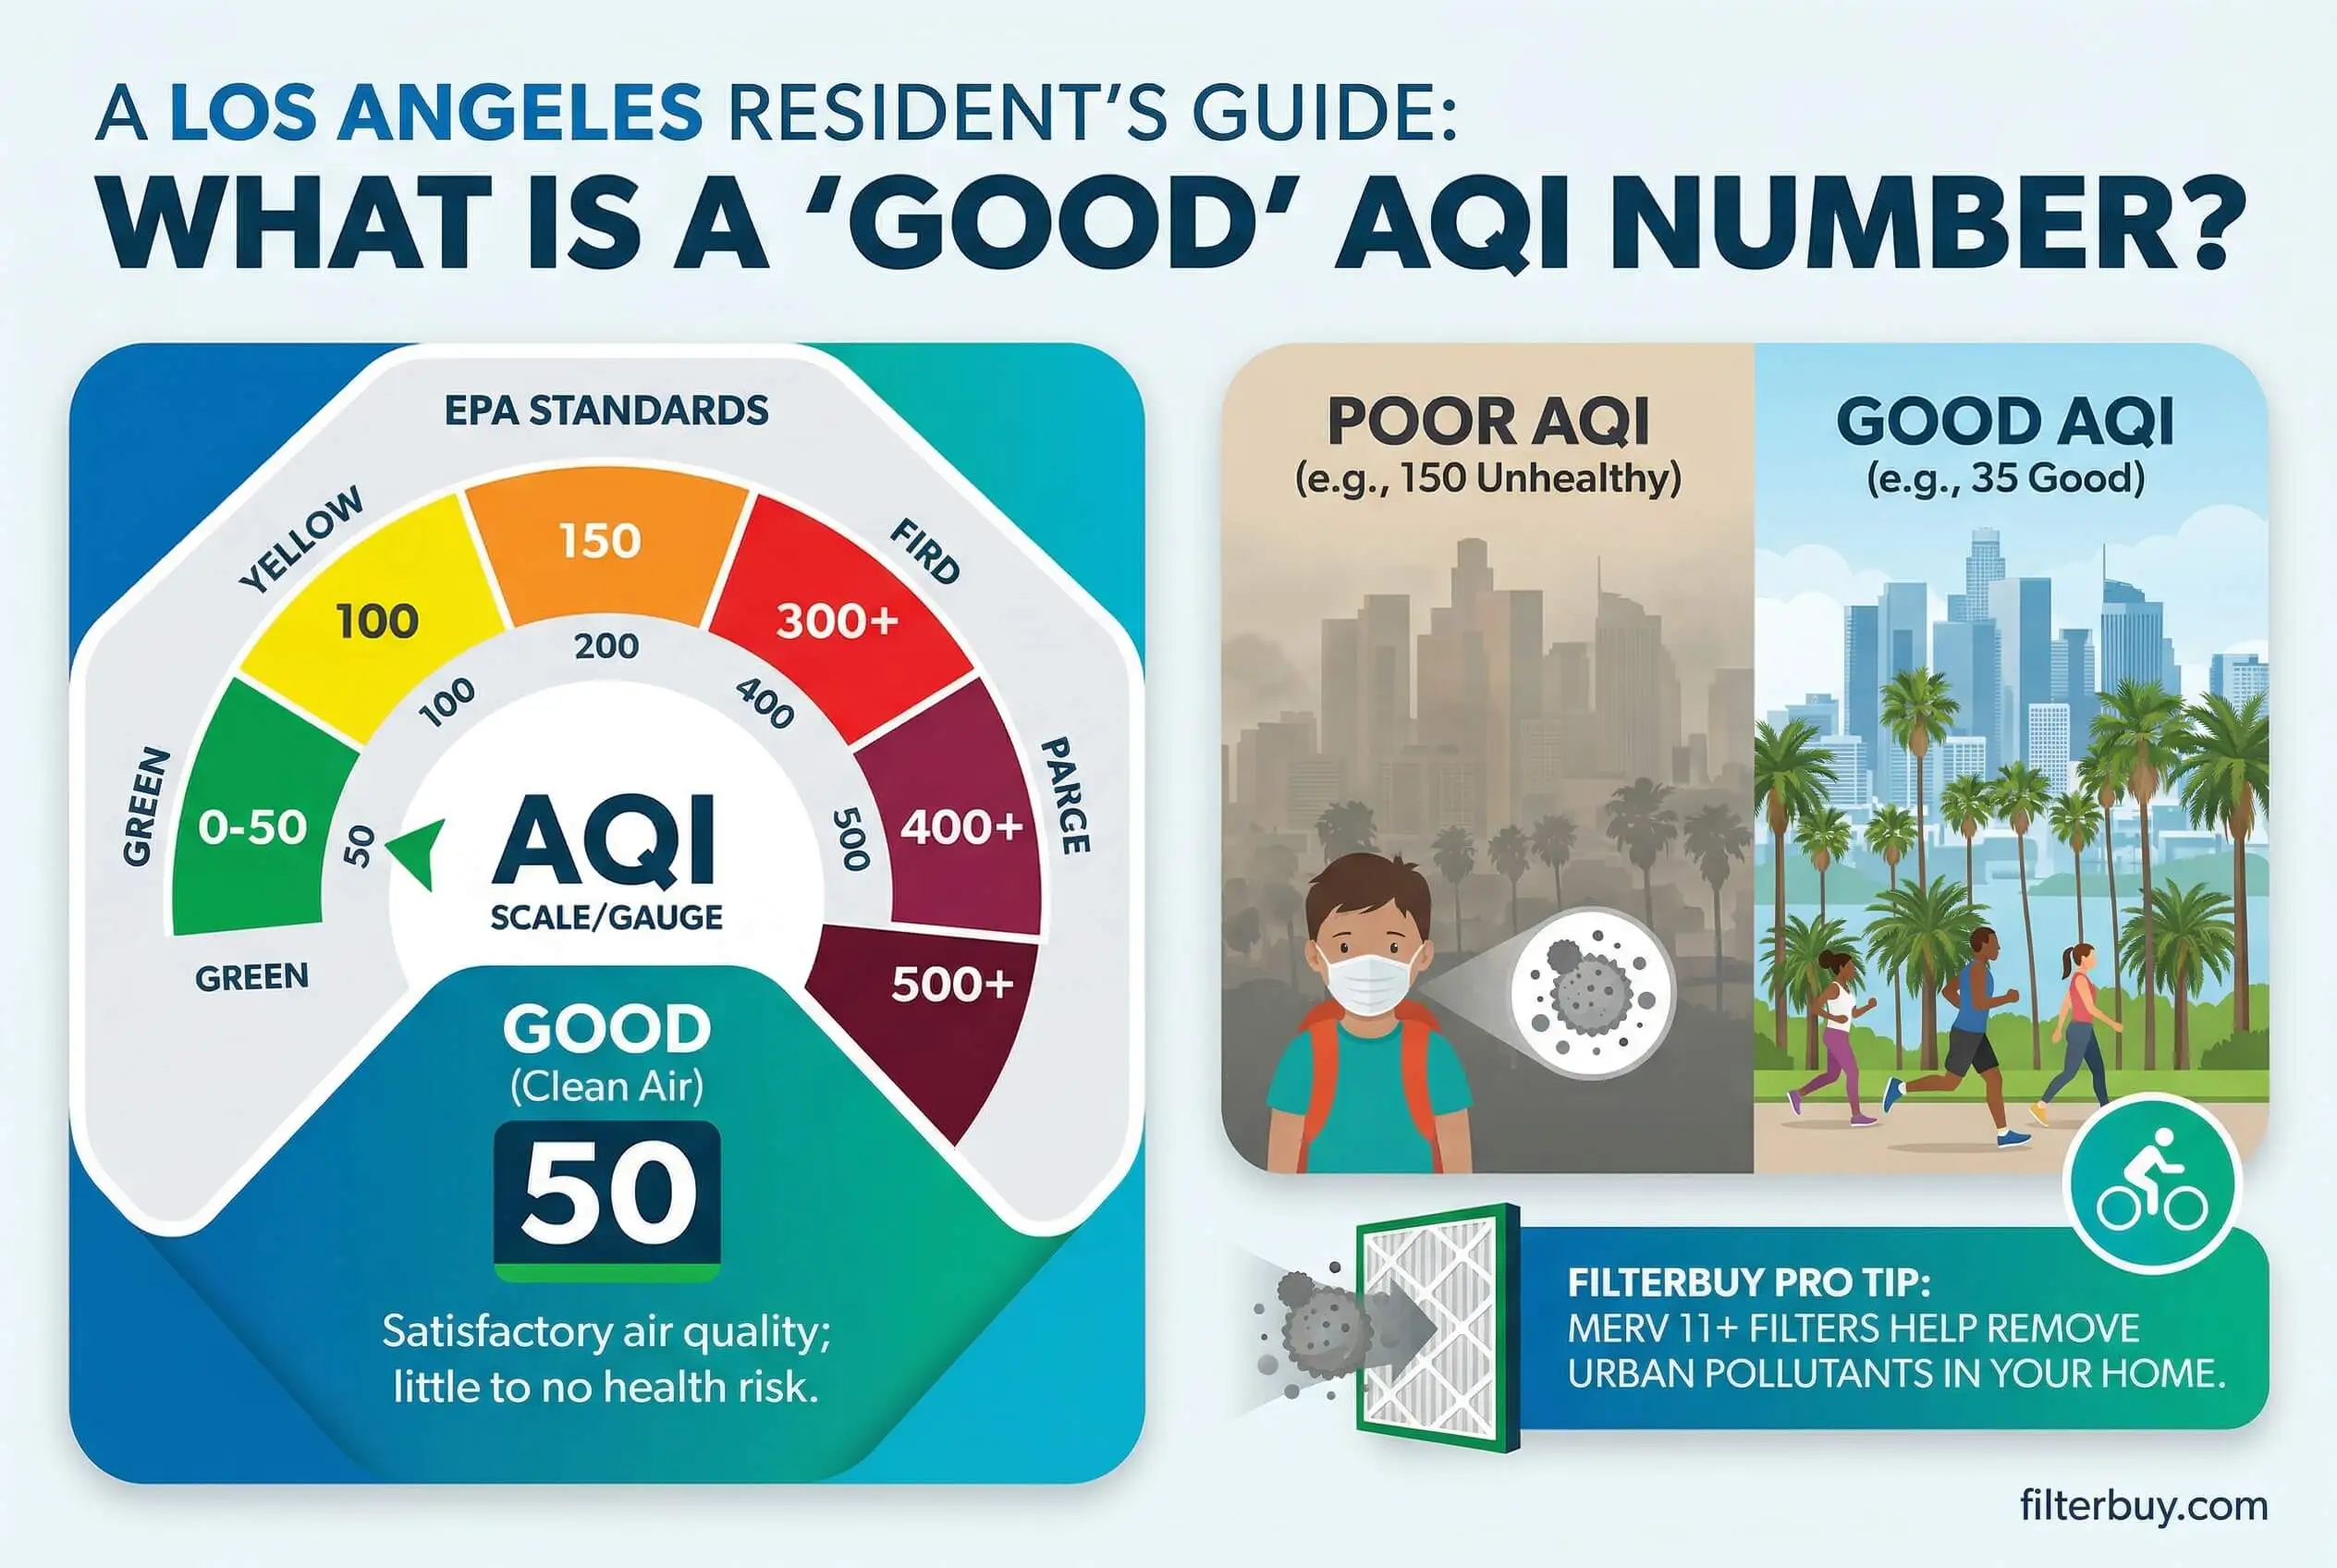
The Air Quality Index runs from 0 to 500 and is divided into six color-coded categories. Each category signals a different level of health concern — and a different level of urgency for your family.
0–50 (Good): Air quality is satisfactory. Little to no risk for all residents.
51–100 (Moderate): Acceptable for most, but a concern for unusually sensitive individuals.
101–150 (Unhealthy for Sensitive Groups): Children, older adults, and those with respiratory conditions should limit prolonged outdoor exposure.
151–200 (Unhealthy): Everyone may begin to experience health effects. Outdoor activity should be reduced.
201–300 (Very Unhealthy): Health alert. Significant risk across all groups.
301–500 (Hazardous): Emergency conditions. The entire population is at risk.
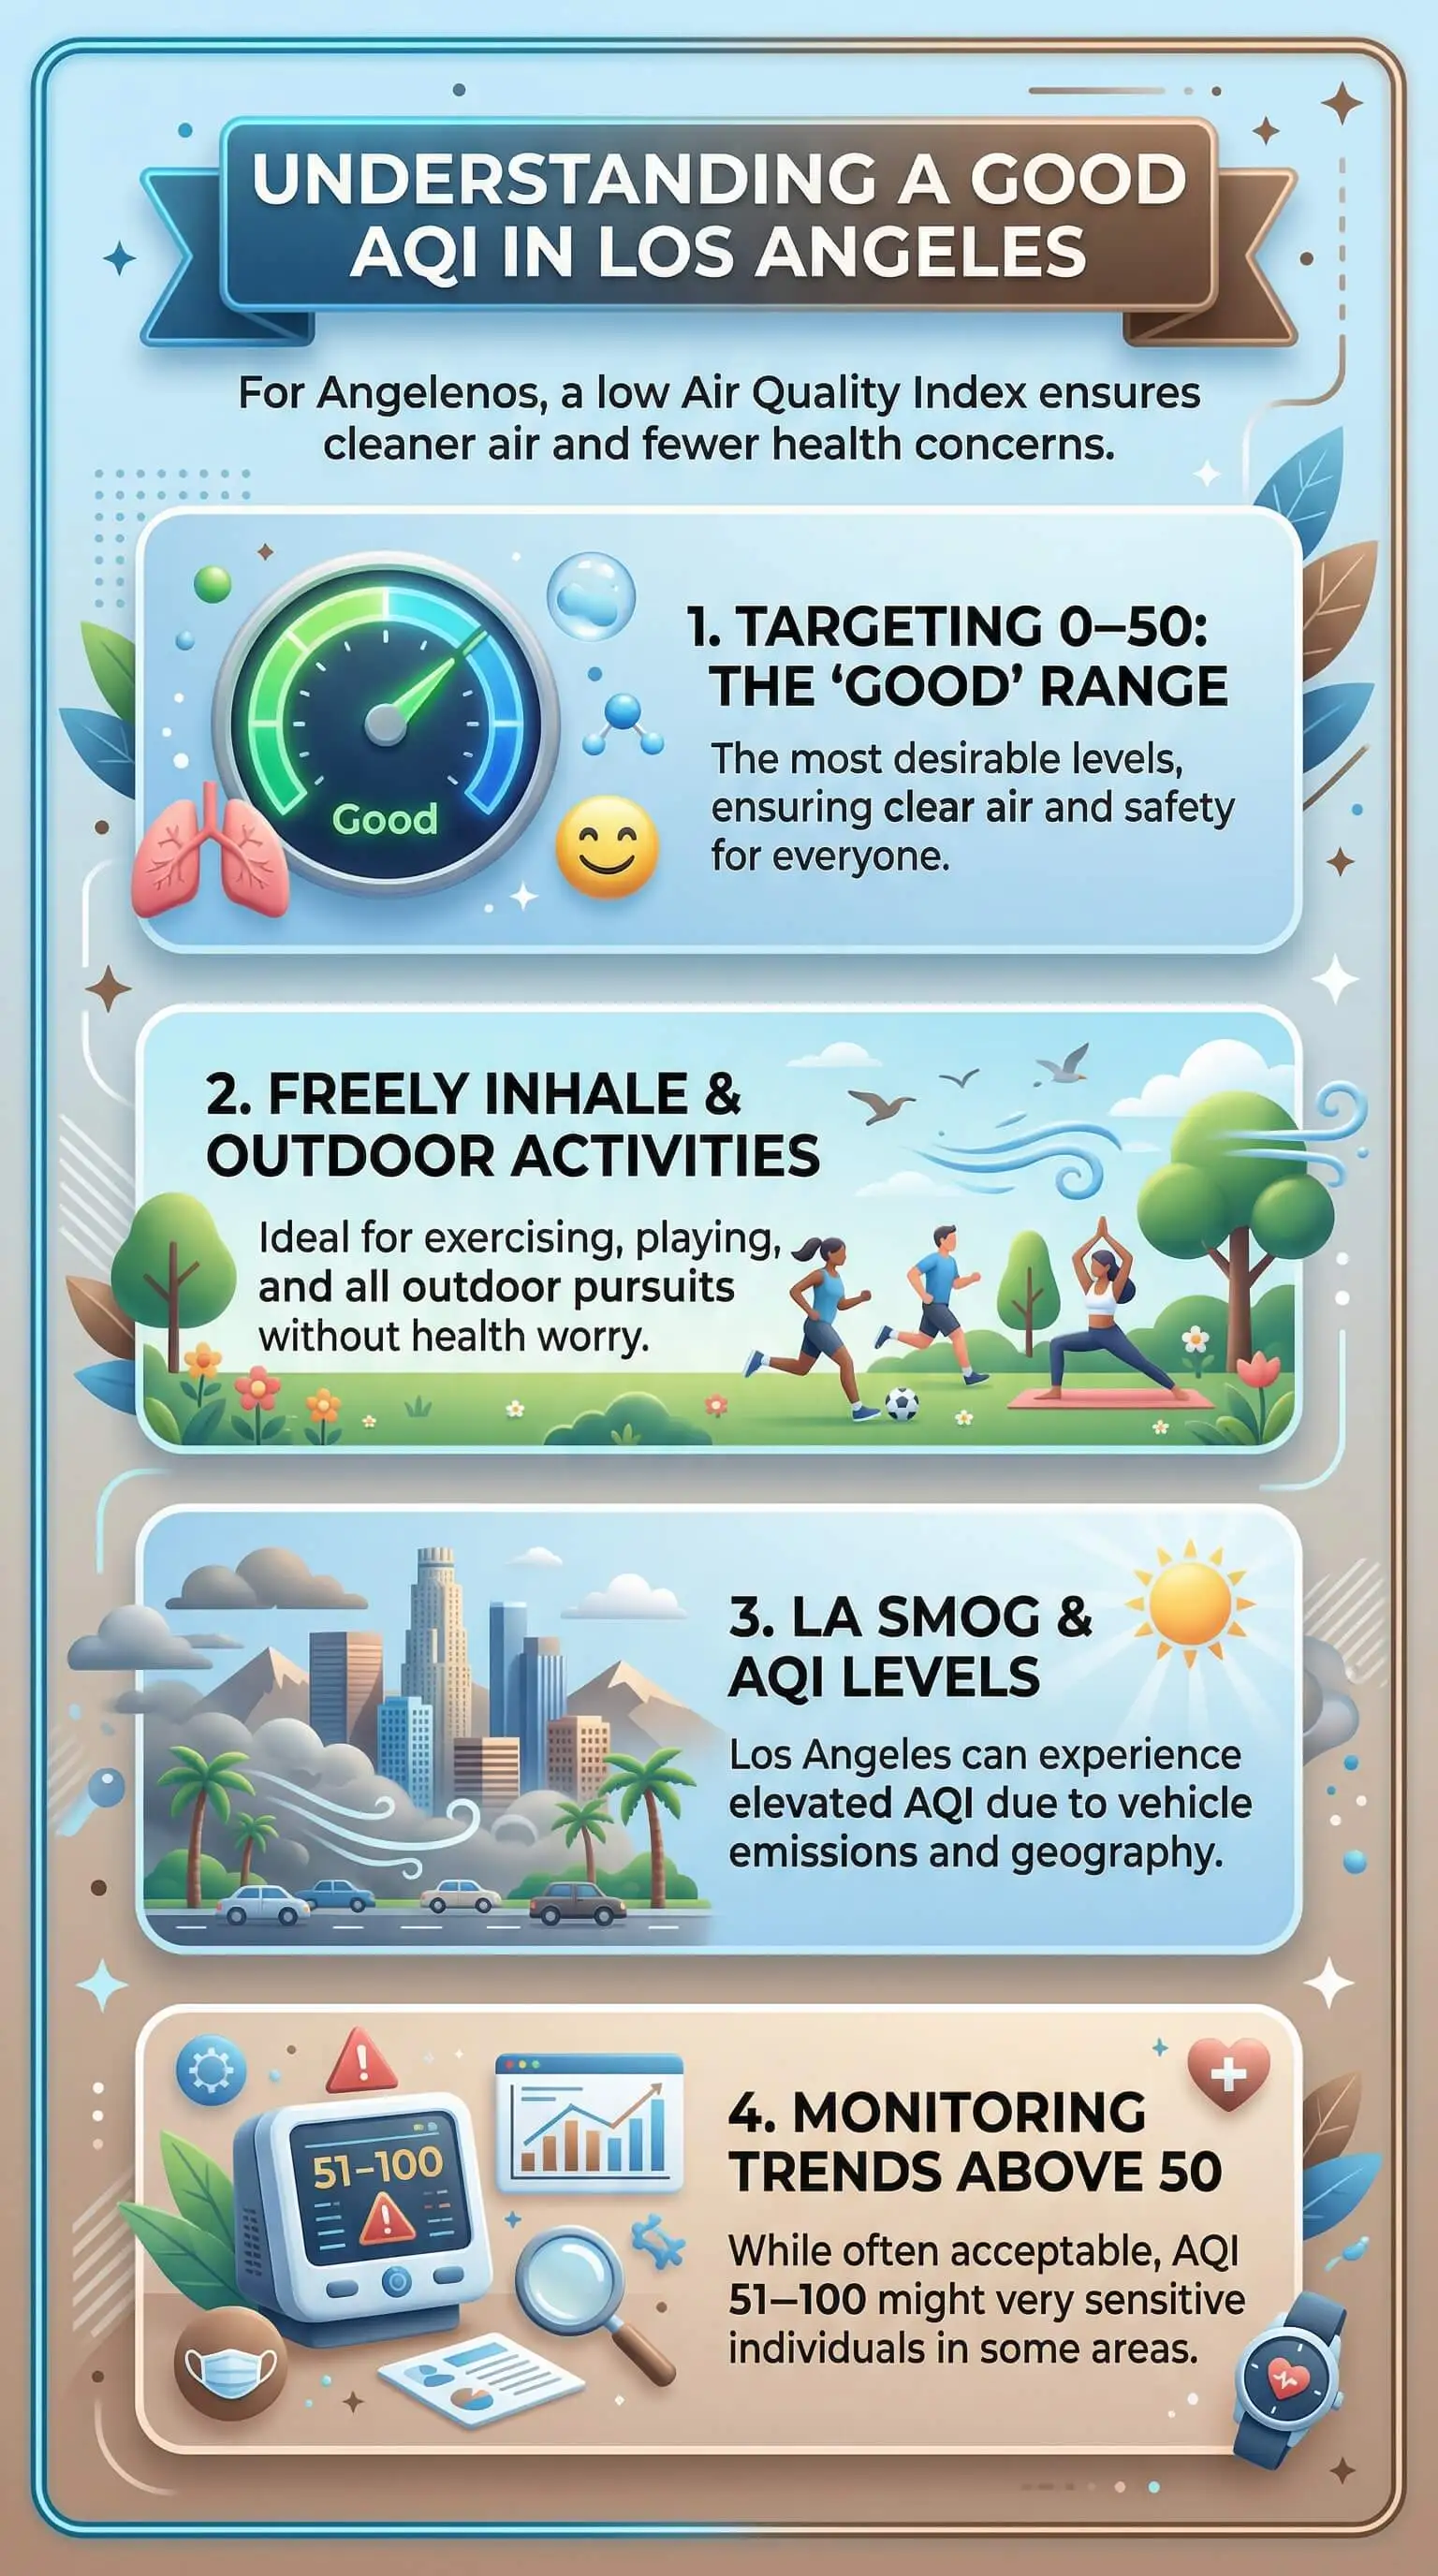
For Los Angeles residents, the target is always 50 or below — but understanding where your day falls on this scale is what separates reactive households from protected ones.
Why Los Angeles AQI Is a Different Challenge Entirely
Most cities deal with one or two persistent air quality drivers. Los Angeles deals with several simultaneously. The L.A. Basin's bowl-shaped geography traps pollutants close to the surface, limiting the natural air circulation that disperses emissions in flatter regions. Layer in vehicle exhaust from one of the most congested freeway networks in the country, seasonal wildfire smoke sweeping in from across the state, and summertime ozone formation driven by intense UV exposure — and you have a compounding air quality problem with few national equivalents.
After manufacturing filters for over a decade and working with customers across Southern California, we've observed that L.A. residents face elevated particulate matter and ozone levels far more frequently than the national average. That reality shapes everything from air ionizer installation and which filter MERV rating your home needs to how often it should be replaced.
What "Moderate" Really Means for Los Angeles Families
An AQI of 51–100 is technically classified as Moderate — and it's the range that catches most L.A. households off guard. On a moderate air quality day, the sky can look clear, news alerts stay quiet, and outdoor activity feels completely normal. But moderate AQI still carries real implications for children, seniors, and anyone managing asthma, allergies, or cardiovascular conditions.
In our experience serving over two million households, the moderate range is where indoor air protection matters most. Outdoor pollutants don't wait at the front door. They infiltrate through windows, gaps in weatherstripping, and HVAC systems running without adequate filtration — quietly elevating indoor particulate levels while residents assume everything is fine because the AQI app reads green or yellow.
The AQI Thresholds That Should Prompt Action in L.A.
Knowing when to act is just as important as knowing the number. Here's how Los Angeles residents should respond at each threshold:
AQI 0–50: Maintain your regular filter replacement schedule. Keep HVAC running normally.
AQI 51–100: Sensitive household members should reduce prolonged outdoor exposure. Check your filter — moderate days add up faster than most residents realize.
AQI 101–150: Limit outdoor activity for children and sensitive groups. Consider running your HVAC fan continuously to maximize indoor filtration.
AQI 151–200: Keep windows closed. Reduce HVAC fresh air intake. Inspect your filter — heavy particle days accelerate clogging.
AQI 201+: Minimize outdoor exposure for all household members. Replace filters sooner than scheduled if smoke or wildfire events are the driver.
How Outdoor AQI Drives Indoor Air Quality in L.A. Homes
This is the connection most air quality guides overlook entirely. Outdoor AQI measures what's in the air around your home — but what your family actually breathes depends on what's happening inside it. In L.A.'s climate, warm temperatures keep windows open longer, which increases pollutant infiltration during elevated AQI periods. Wildfire smoke events introduce ultra-fine particulate matter — PM2.5 — that passes through low-rated filters almost unimpeded.
A higher MERV-rated filter is your home's most consistent line of defense when outdoor conditions deteriorate, especially when the real time air quality index shows conditions worsening. After more than a decade of manufacturing filters and tracking customer feedback across wildfire and high-ozone seasons, we've found that households running MERV 11 or MERV 13 filters consistently report better air quality outcomes during L.A.'s most challenging air quality periods. The filter your HVAC system holds is doing invisible work every day — and in Los Angeles, that work is heavier than most residents account for.
"Los Angeles is one of the most demanding air quality environments we see across the more than two million households we serve — and the pattern that surprises people most isn't the hazardous days, it's the moderate ones. After over a decade of manufacturing filters and tracking how they perform across wildfire seasons, high-ozone summers, and heavy traffic corridors, we've seen firsthand how quickly a yellow AQI day loads up a filter that residents assume still has weeks of life left. In L.A., the air is always working harder than the number on your phone suggests — and your filtration needs to keep pace with it."
Essential Resources
After manufacturing air filters for over a decade and serving more than two million households, we know that protecting your family's air starts with knowing what's in it and choosing the right pleated air filter. These seven authoritative sources give Los Angeles residents the real-time data, historical context, and health guidance needed to make confident decisions — indoors and out.
1. AirNow.gov — The EPA's Official Starting Point for L.A. Air Quality
When you need a number you can trust, AirNow is where to start. Operated by the U.S. EPA, this real-time map delivers current AQI readings, next-day forecasts, and health guidance sourced directly from official California monitoring stations — no third-party interpretation, no lag.
https://www.airnow.gov/state/?name=california
2. South Coast AQMD — The Most Precise Neighborhood-Level AQI Map for the L.A. Basin
Most AQI maps show you the county. This one shows you your neighborhood. The South Coast Air Quality Management District's interactive map blends regulatory monitoring data with hundreds of fine particle sensors to generate readings at more than 1,000 locations across Los Angeles, Orange, San Bernardino, and Riverside counties. In our experience, this is the resource L.A. households should have bookmarked year-round.
https://www.aqmd.gov/home/air-quality/current-air-quality-data
3. South Coast AQMD Air Quality Forecasts — Know What's Coming Before It Reaches Your Front Door
Don't take your outdoor air for granted — especially in Los Angeles. The South Coast AQMD posts daily and next-day AQI forecasts by noon, including wildfire smoke alerts and zip code-level smog outlooks. Checking this before planning outdoor activity is one of the simplest ways to protect your family on high-pollution days.
https://www.aqmd.gov/home/air-quality/air-quality-forecasts
4. South Coast AQMD Subregion Readings — See Where Your Corner of L.A. Actually Stands
Los Angeles doesn't breathe as one. Air quality in the San Fernando Valley, Central L.A., and the South Coast corridor can vary significantly on the same day. This resource breaks current readings down by subregion — giving residents in L.A.'s most pollution-variable areas the hyperlocal data they need to make informed decisions.
5. California Air Resources Board (CARB) — Understand Why L.A. Is Held to a Higher Standard
California doesn't settle for federal minimums when it comes to air quality — and CARB is the reason why. As the state authority on emissions policy and regional air quality standards, CARB sets the regulatory framework that drives South Coast AQMD's work across the Los Angeles Basin. Understanding this context helps residents interpret AQI data with the full picture in mind.
https://ww2.arb.ca.gov/south-coast-air-quality-management-district
6. AirNow.gov AQI Basics — Make the Invisible Visible: What Every AQI Number Really Means
A number on a screen is only useful if you know what it means for your family. The EPA's AQI Basics guide explains how the Air Quality Index is calculated, what each color-coded category represents, and how to translate readings into real protective action. We point every customer here first — because informed households make better decisions.
https://www.airnow.gov/aqi/aqi-basics/
7. LA Almanac: Air Quality Days by Year — The Historical Record Every L.A. Household Should See
Here's something that might surprise you: using EPA Air Quality Index Daily Values Reports as its source, the LA Almanac's historical record shows exactly how many Good, Moderate, and Unhealthy air quality days Los Angeles County logs each year. For families weighing long-term filtration decisions, this data tells a more honest story than any single-day AQI reading ever could.
http://www.laalmanac.com/environment/ev01b.php
Supporting Statistics
Most air quality guides lead with national averages. We'd rather show you what the data looks like for Los Angeles specifically — because after manufacturing filters for over a decade and serving more than two million households, we know L.A. is not an average market.
Los Angeles County Ranked Third in the Nation for Unhealthy Air Quality Days in 2025
In 2025, Los Angeles County logged the third-highest number of unhealthy air quality days of any county in the United States, per EPA Air Quality Index Daily Values Report data. What this means for L.A. households:
San Bernardino and Riverside were the only two counties that ranked worse
L.A. households absorb a particle load most of the country never experiences
Above-average filtration in this market is not an upgrade — it is the starting point
Source: LA Almanac — Air Quality Days by Year for Los Angeles County (sourced from U.S. EPA Air Quality Index Daily Values Reports) http://www.laalmanac.com/environment/ev01b.php
Nearly 1 in 13 Children in Los Angeles County Has Been Diagnosed With Asthma
The 2023 Los Angeles County Health Survey found that 7.3% of children ages 0 to 17 in L.A. County have asthma. Key findings from the report:
Rates climb to 9.5% among Black and African American children
Children of Latino ancestry are affected at a rate of 8%
Proximity to heavily trafficked roads and industrial corridors is identified as a leading environmental driver
This mirrors what we see in our own customer data. Households closest to L.A.'s most congested freeway corridors replace filters more frequently and report more air quality concerns than nearly any other segment we serve. The research, indoor air quality testing, and our real-world experience point to the same conclusion: in Los Angeles, the air quality risk that matters most for children is the one happening indoors.
Source: Los Angeles County Department of Public Health — Public Health Releases Report on the Impact of Asthma on Children in Los Angeles County (October 2, 2025) https://lacounty.gov/2025/10/02/public-health-releases-report-on-the-impact-of-asthma-on-children-in-los-angeles-county/
Los Angeles County's Annual PM2.5 Levels Run Nearly 50% Above the EPA's Own Safety Standard
EPA design value data covering 2020 to 2022 shows Los Angeles County's PM2.5 annual design value at 13.4 µg/m³ — against the EPA's revised annual primary standard of 9.0 µg/m³. Here is what that gap means in practice:
The fine particulate matter L.A. residents breathe exceeds the EPA's own safety threshold on an annual average basis
This is before wildfire seasons, Spare the Air alerts, or high-ozone afternoons are factored in
PM2.5 at these concentrations has been linked to heart disease, respiratory illness, and premature death
Fine particulate matter at this level passes through low-rated filters without resistance
After more than a decade of manufacturing filters and tracking how quickly they load during L.A.'s worst air quality periods, this is the single most important number we point to when residents ask why MERV rating matters more here than almost anywhere else we ship.
Source: U.S. Environmental Protection Agency — PM2.5 Annual Design Values by County, 2020–2022 https://www.epa.gov/system/files/documents/2024-02/table_annual-pm25-county-design-values-2020-2022-for-web.pdf
Final Thoughts
A good AQI for Los Angeles is 50 or below. But after manufacturing air filters for over a decade and serving more than two million households, our honest opinion is this: thanks in part to the progress driven by the clean air act, chasing a daily number without a plan for what happens inside your home is only half the equation — and in Los Angeles, there is real opportunity to protect your family even more effectively indoors.
Here is what the data and our firsthand experience tell us that most air quality guides won't.
Los Angeles Is One of the Most Deceptive Air Quality Environments in the Country
The worst days are easy to spot. Wildfire smoke and Stage 1 alerts make those visible. The real risk lives in the moderate days — when the AQI reads 65 or 80, the sky looks clear, and households let their guard down. Those are the days we consistently see filters loaded with fine particulate matter that residents assumed still had weeks of life left.
The structural challenges driving this are well-documented:
The L.A. Basin's geography traps pollutants close to the surface
Its freeway network generates them at scale, around the clock
Wildfire seasons inject ultra-fine particles that low-rated filters cannot capture
Annual PM2.5 levels run nearly 50% above the EPA's own safety standard — even in relatively quiet years
Our Perspective, Earned Through More Than a Decade in This Market
The households that protect their families most effectively in Los Angeles are not the ones refreshing an AQI map every morning. They are the ones who have:
Matched their indoor filtration to the actual demands of the L.A. environment
Selected the right MERV rating for local air quality conditions
Replaced filters on a schedule that reflects how quickly L.A. air loads a filter — not a national average timeline
The number on your AQI app is a starting point, not a finish line. Los Angeles deserves an air quality strategy that accounts for what the city actually is — not what a single daily number suggests it might be.
FAQ on Air Quality Index Map Los Angeles
Q: Where can I find the most accurate real-time air quality index map for Los Angeles?
A: Use two sources together for the clearest picture:
South Coast AQMD (aqmd.gov) — neighborhood-level readings at more than 1,000 locations across the Basin. The most granular publicly available tool for L.A. residents.
EPA AirNow (airnow.gov) — the federal benchmark with current readings and next-day forecasts.
In our experience, using both together gives households the most accurate view of what is moving through their corner of the Basin on any given day.
Q: What is a good AQI number for Los Angeles residents?
A: The EPA classifies 50 or below as Good. In Los Angeles, that threshold is harder to hold than almost anywhere else we serve. Here is why:
Basin geography, traffic emissions, and wildfire smoke keep L.A. in the Moderate range of 51–100 for a significant portion of the year
Moderate is the range that catches most households off guard
The days that feel safe outdoors are often the days indoor air quality suffers most
After more than a decade of manufacturing filters and tracking performance across Southern California, this is the pattern we see most consistently.
Q: How does wildfire smoke affect the air quality index map in Los Angeles?
A: Faster and longer than most residents expect. When smoke enters the Basin:
L.A.'s bowl-shaped geography traps it close to the surface
AQI readings spike across the map and persist well beyond the fire event itself
Wildfire smoke carries ultra-fine PM2.5 particulate matter that passes through low-rated filters without meaningful resistance
During active smoke events, we advise residents to:
Close windows immediately
Reduce HVAC fresh air intake
Inspect filters right away — regardless of where they sit on the normal replacement schedule
Q: Why does the air quality index vary so much across different Los Angeles neighborhoods?
A: Because Los Angeles does not breathe as one. Key drivers of neighborhood-level AQI variation include:
Freeway corridors and heavy traffic zones
Industrial areas and port operations near Los Angeles and Long Beach
Wildfire smoke pathways that move unevenly across the Basin
Coastal neighborhoods that benefit from ocean airflow others do not receive
A single daily AQI reading for Los Angeles can mask conditions that are meaningfully worse in a specific neighborhood. The South Coast AQMD's subregion monitoring tool gives a far more accurate picture than the county-wide number alone.
Q: How does the outdoor air quality index in Los Angeles affect indoor air quality at home?
A: More directly than most residents realize. Outdoor pollutants enter homes through:
Open windows — more common in L.A.'s warm climate, extending infiltration during elevated AQI periods
Weatherstripping gaps in doors and window frames
HVAC systems running without adequate filtration
The result: a Moderate outdoor AQI day does not stay outside. It quietly raises indoor particulate levels while the app still reads yellow. After manufacturing filters for over a decade and serving more than two million households, we have found that:
MERV 11 filters provide meaningful protection on routine Moderate AQI days
MERV 13 filters are the most effective defense during wildfire and high-ozone events
Replacing filters on a schedule matched to L.A. conditions — not national averages — is what makes the difference
Protect Your Home From Los Angeles Air Quality — Starting With the Right Filter
Now that you know what a good AQI number means for Los Angeles residents, take the next step toward protecting the air inside your home. Shop Filterbuy's MERV 11 and MERV 13 air filters — manufactured in the USA and built for the demands of the L.A. environment.


